 Monitor your iTop
221
installs
Monitor your iTop
221
installs
221
installs
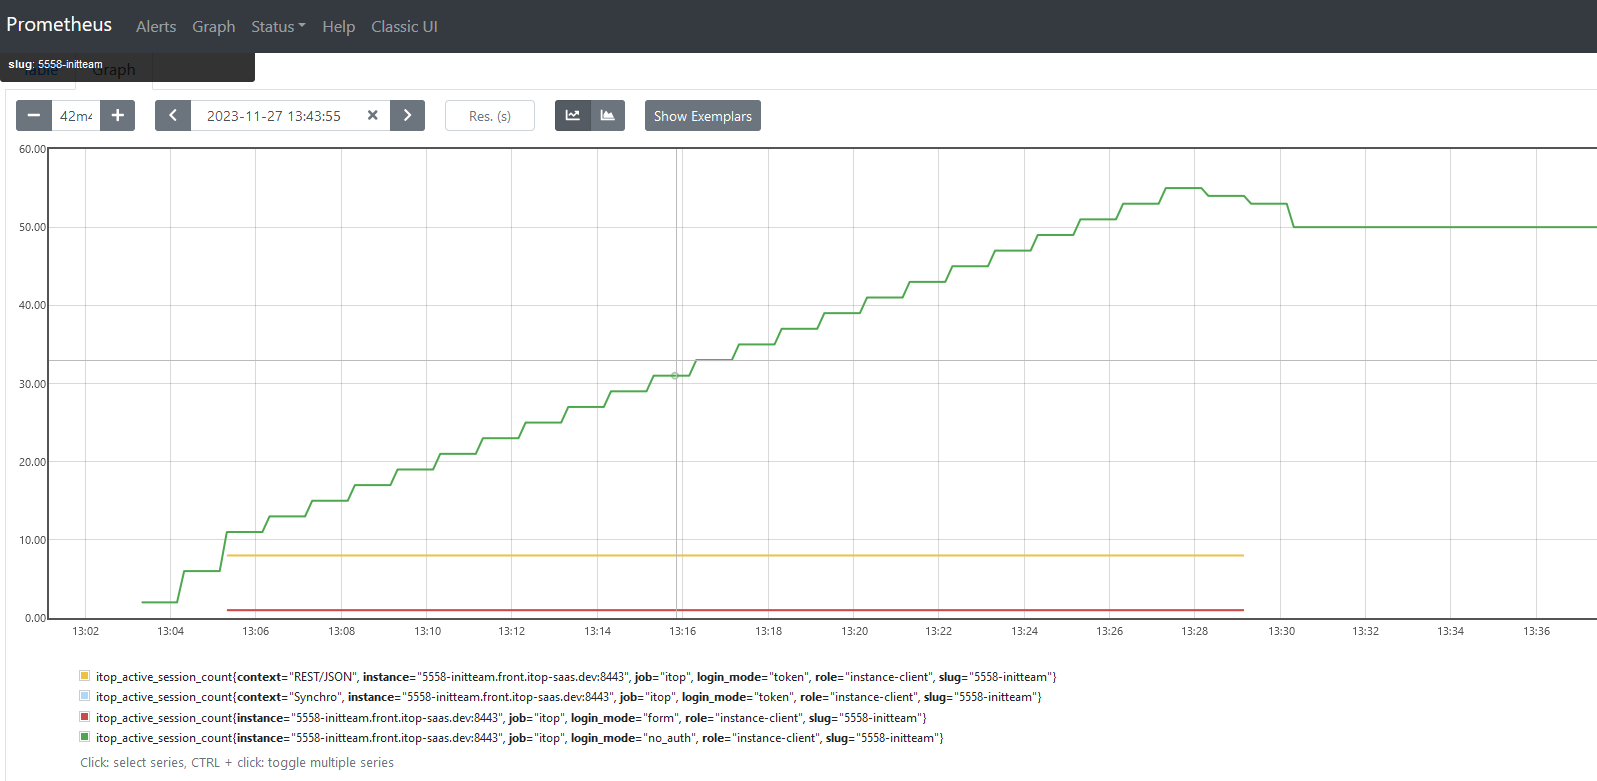
As administrators you can monitor iTop instances via http(s) endpoints and oversee incidents coming in production.
Pick among out-of-the-box KPIs to define your own endpoints:
You can also code your own metrics via dedicated PHP APIs.
Watch the video for more details


Are you sure you want to perform this action?